

What the Average Family Budget Actually Looks Like in 2026
Money talk usually starts with a guess. Someone says housing should eat up 30 percent of your paycheck, or that the “average” family spends this or that, and there’s rarely a number behind it. The average family budget in 2026 is built on the most recent hard data available: the Bureau of Labor Statistics 2024 Consumer Expenditure Survey, released in December 2025, the newest full-year figures the government has published. This piece breaks down exactly where that money goes, who spends more, who spends less, and how your own household might compare.
This matters whether you’re a single parent stretching one income across everything, a two-income household trying to figure out if your housing costs are normal, or someone just trying to build a budget that reflects reality instead of internet advice. The numbers below come from real government surveys of real American households, not estimates pulled out of thin air.
[DIRECT ANSWER BLOCK] According to the Bureau of Labor Statistics, the average family budget in 2026, based on the latest 2024 Consumer Expenditure Survey, totals $78,535 in annual spending against $104,207 in average income before taxes. Housing takes the largest share at 33.4 percent, followed by transportation at 17.0 percent and food at 12.9 percent. Actual spending varies widely by income level and household type.
How the Average Family Budget in 2026 Breaks Down by Category
The Bureau of Labor Statistics splits household spending into fourteen major categories, and the shares tell a clear story about where American paychecks actually go. Housing alone accounts for a third of the average family budget. That single category, at $26,266 a year, or roughly $2,189 a month, is more than double the next biggest expense.
Transportation comes in second at $13,318 a year, or about $1,110 a month, representing 17.0 percent of total spending. That figure covers car payments, gas, insurance, and maintenance combined, not just one piece of it. Food takes 12.9 percent of the average budget, and personal insurance and pensions, which includes retirement contributions and Social Security withholding, takes another 12.5 percent.

Healthcare sits at 7.9 percent. Entertainment is 4.6 percent. Cash contributions, meaning gifts and support sent to others, come in at 2.9 percent. Education is 2.0 percent, apparel is 2.5 percent, and the remaining slices (personal care, reading, tobacco, alcohol, and miscellaneous spending) each take up less than 2 percent apiece.
Here’s the full picture, according to BLS Consumer Expenditure Survey data:
| Category | Share of Total Spending |
|---|---|
| Housing | 33.4% |
| Transportation | 17.0% |
| Food | 12.9% |
| Personal insurance and pensions | 12.5% |
| Healthcare | 7.9% |
| Entertainment | 4.6% |
| Cash contributions | 2.9% |
| Apparel and services | 2.5% |
| Education | 2.0% |
| Miscellaneous | 1.6% |
| Personal care products and services | 1.2% |
| Tobacco products | 0.4% |
| Alcoholic beverages | 0.8% |
| Reading | 0.2% |
A budget percentage means nothing without a number attached to it, though. If you can only put $50 a month toward transportation savings because housing already ate your raise, that’s not a personal failure. It reflects a national pattern where one category, housing, has grown faster than almost everything else in the average family budget for years running.
Why “Average” Rarely Feels Like Your Household
Nobody actually lives at the average. The $78,535 figure blends together a single 24-year-old renting a studio apartment, a retired couple living on savings, and a family of five with two mortgages worth of expenses. Averages flatten all of that into one number that describes nobody perfectly.
Income drives most of the variation, and the gap is enormous. Consumer units in the lowest income quintile spent an average of $35,046 in 2024, while those in the top quintile spent $150,342, more than four times as much, according to the same BLS survey. If your spending doesn’t match the headline number, you’re not broken. You’re probably just not the “average” household the survey is describing, and almost nobody is.
There’s also a difference between a household’s spending and a household’s income. The average family budget in 2026 reflects a gap where average income before taxes was $104,207, well above the $78,535 spent. That gap includes savings, retirement contributions already counted separately under personal insurance and pensions, and taxes that come out before a paycheck ever lands in a checking account.
Average Family Budget 2026 Data by Household Type
Married couples with children spend differently than the “all consumer units” average, and the difference shows up most clearly in housing. According to BLS data comparing household compositions, married couples with children allocated the lowest housing share of any group, 30.6 percent, while putting the highest share of any group, 15.1 percent, toward personal insurance and pensions. That’s a household prioritizing retirement and life insurance over square footage, likely because two incomes and employer retirement matches are doing real work in the background.
Married couples without children showed the opposite pattern. They put 37.3 percent of spending toward housing, the highest share of any household type, while allocating the lowest shares to healthcare (4.9 percent) and entertainment (3.8 percent). Without children in the house, housing costs still claim the biggest single piece of the budget, just a bigger piece than families with kids carry.
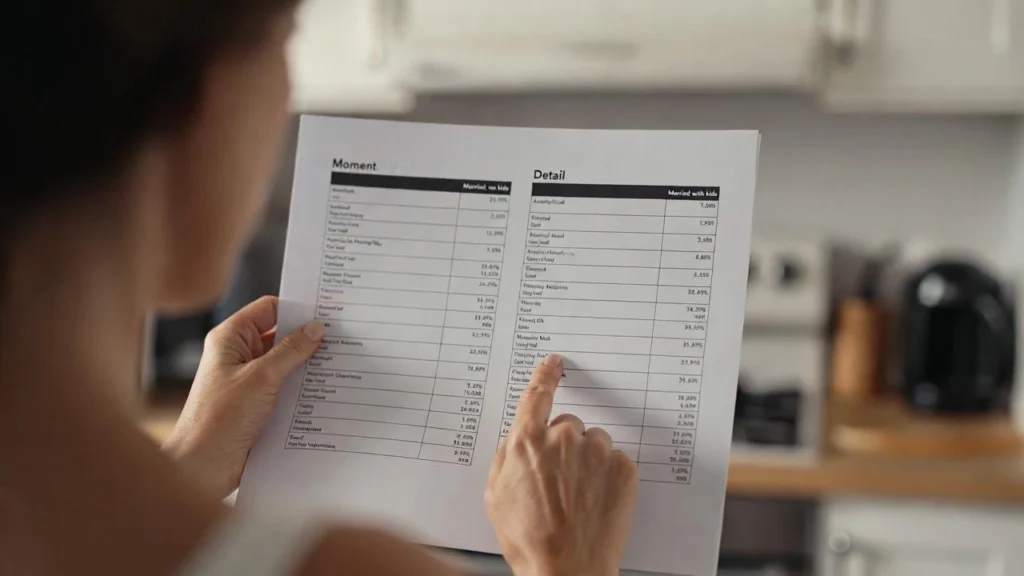
Here’s what stands out: families with children aren’t overspending on housing compared to other households. They’re actually spending a smaller share on it, likely because more of their income gets pulled toward insurance, savings, and the day-to-day cost of raising kids that show up scattered across other categories.
A single mom without a second income doesn’t show up as her own category in these tables, but the pattern still applies. Every dollar that would have gone toward a second earner’s transportation or discretionary spending in a two-income household has to stretch across the same core categories: housing, food, and insurance, on one income instead of two. If you want a more detailed framework built specifically around single-income budgeting, the 50/30/20 approach adapted for one income breaks down how to prioritize when there’s no second paycheck to lean on.
The Hard Numbers: Average Family Budget 2026 by Income Level
Income quintile breaks are one of the most useful ways to see where your own household actually lands, because “average” income and “average” spending mean different things depending on which fifth of the country you’re in.
According to 2024 BLS data, the income quintile boundaries looked like this: the second quintile started at $29,932, the third at $57,452, the fourth at $94,511, and the top quintile began at $155,925. If your household income falls in the $57,452 to $94,511 range, you’re sitting in the middle of the national income distribution, not behind and not ahead.
Spending scales with income, but not in a straight line. The lowest quintile spent $35,046 on average, a number that likely represents spending exceeding income for many of those households, since government assistance, savings drawdown, and credit often fill gaps that wages alone can’t cover. The top quintile spent $150,342, over four times as much. Somewhere in between, most American families are making decisions about which categories to protect and which to cut when the math gets tight.
If your household brings in $65,000 a year and you’re trying to hit the national housing share of 33.4 percent, that’s about $1,807 a month for shelter, utilities, and everything housing-related combined. If your rent or mortgage alone eats past that, you’re not imagining that things feel tighter than the “average” suggests. You’re carrying a housing cost that outpaces your income bracket’s typical share, and that’s worth naming directly instead of assuming something else in your budget must be the problem.
What Changed in the Average Family Budget in 2026
Housing costs didn’t just stay high, they kept climbing. According to BLS data, average annual expenditures on housing increased 3.3 percent in 2024, following a 4.7 percent increase the year before. Within that category, spending on owned dwellings rose 7.0 percent and spending on rented dwellings rose 5.4 percent, meaning renters and owners both absorbed real increases, just through different mechanisms: rising rents on one side, and higher mortgage costs or property taxes on the other.
That two-year stretch of housing increases outpacing overall spending growth is the single biggest driver behind why the average family budget in 2026 feels tighter than it did a few years back, even for households whose income has technically gone up. When one category eats a growing share of the pie every year, something else in the budget has to shrink to make room, whether that’s discretionary spending, savings, or both.
A sinking fund, meaning money set aside gradually for a specific future expense like a car repair or holiday spending, can help absorb some of that pressure without derailing the rest of a budget. But sinking funds only work when there’s actual room left after housing and transportation take their share, and for a growing number of households, that room has been shrinking year over year.
I am not a financial advisor and this is not financial advice. For your specific situation, talk to a qualified professional, especially if you’re weighing decisions like refinancing, taking on new debt, or restructuring your housing costs.
Where Your Own Numbers Fit Into This Picture
Comparing your household to a national average is only useful up to a point. The real value in the average family budget 2026 numbers isn’t matching them exactly. It’s using them as a reference point to spot where your own spending has drifted further from typical than you realized.
Start with housing. If you’re spending noticeably more than 33.4 percent of your income there, that single number explains a lot about why other categories feel impossible to fund. Next, look at transportation. At 17.0 percent nationally, a paid-off car or a shorter commute can free up real room elsewhere in a budget that a dozen small subscription cancellations never could.
Food, at 12.9 percent, is the category most people try to cut first and the one that often has the least room to give, especially for larger households. A grocery leak (meaning spending drifting up gradually without a single obvious cause) is worth auditing directly rather than assuming willpower alone will fix it. If that’s a pattern you recognize, a structured spending leak audit walks through how to find where the money is actually going before deciding what to cut.
The goal isn’t to hit the national average in every category. It’s to understand which categories in your own budget have grown out of proportion to what similar households are spending, so you know exactly where to focus first.
The income line in your budget is rarely the whole story. If you are working outside the home, run your real hourly wage to see what the job leaves you after childcare, driving and the hours nobody pays for.
People Also Ask
What is a good average family budget for 2026?
There’s no single “good” number, since it depends entirely on household size, location, and income. According to BLS data, the average family budget in 2026 runs about $78,535 a year, with housing at 33.4 percent and transportation at 17.0 percent. A workable target is keeping housing under a third of take-home pay, though costs in high-price metro areas often run higher than the national average suggests.
How much should a family budget for housing in 2026?
Based on the average family budget 2026 breakdown from BLS, housing typically takes 33.4 percent of total spending nationally, though married couples with children average slightly lower at 30.6 percent. That works out to roughly $2,189 a month for the typical household, though this includes rent or mortgage, utilities, insurance, and maintenance combined, not rent alone.
How much does the average American family spend per month?
According to the BLS Consumer Expenditure Survey, the average family budget in 2026 totals $78,535 annually, which breaks down to about $6,545 a month across all spending categories. That figure varies enormously by income quintile, ranging from roughly $2,920 a month for the lowest-earning households to $12,529 a month for the highest.
Why does my family spend more than the average family budget?
Spending above the national average family budget for 2026 often traces back to one category outpacing its typical share, most commonly housing, which increased 3.3 percent in 2024 alone according to BLS data. Location, family size, and whether you’re renting versus owning all shift these numbers significantly, so comparing your specific income quintile is more useful than comparing to the overall average.
Start With One Category, Not the Whole Budget
Trying to rebuild an entire budget around national averages all at once usually backfires. Pick the one category in the average family budget 2026 breakdown where your own numbers are furthest from typical, whether that’s housing eating more than its share or transportation costs quietly climbing, and start there.
Real change comes from comparing your specific numbers against a real benchmark, then making one adjustment at a time instead of trying to overhaul everything on the same afternoon. The average family budget in 2026 isn’t a target to hit exactly. It’s a mirror that shows you where your own spending has room to breathe, and where it doesn’t.